
When doing regression analysis, most data analysts expect that the coefficient associated with a predictor variable will get smaller (closer to zero) when other variables are added to the regression model. But if the analysts are experienced, they also know that sometimes a coefficient gets larger when other variables are added. That’s commonly known as a “suppressor effect,” and the additional variable is called a “suppressor variable”.
I thought I knew all about suppressor effects. It turns out I was wrong. A few weeks ago, I was asked the following (paraphrased) question by Adam Abdulla, an Associate Lecturer at Robert Gordon University in Scotland:
Suppose we have three variables, y, x1, and x2. The correlations among these three variables are all positive. If we then do an OLS regression of y on x1 and x2, will the standardized coefficients for x1 and x2 necessarily be smaller than their bivariate correlations? In other words, if all correlations are positive, can we have a suppressor effect?
My initial answer was no. For a suppressor effect to occur, there has to be an inconsistency of signs. For example, x1 and x2 both have positive correlations with y, but they are negatively correlated with each other. Or, x1 and x2 are positively correlated with each other, but one is negatively correlated with y and the other is positively correlated with y.
Well, as pointed out by another one of Adam’s correspondents, that was a serious error. Yes, there will be a suppressor effect if the correlations are inconsistent in sign. But it can easily be proved that suppressor effects can occur even when all correlations are positive.
LEARN MORE IN A SEMINAR WITH PAUL ALLISON
Here is the basic result. We start with three correlations, labeled as
ry1 (the correlation between y and x1)
ry2 (the correlation between y and x2)
r12 (the correlation between x1 and x2).
We assume that all three are positive. The standardized coefficients for the regression of y on both x1 and x2 are labeled py1 and py2. [In this post, I’ll focus on standardized coefficients, but the same conclusions apply to unstandardized coefficients.] We want to know how py1 compares with ry1 (since ry1 is the standardized coefficient in a bivariate regression of y on x1).
The simple answer is this: It can be shown that py1 > ry1 whenever ry1r12 > ry2.
What this inequality says is that you’re likely to get a suppressor effect when the correlation between two predictors is high, but their correlations with the dependent variable are very discrepant (i.e., one is substantially larger than the other). A bit later, I’ll make this conclusion more precise.
There is an additional, and somewhat surprising, consequence of ry1r12 > ry2 , and that is that py2, the standardized coefficient for the other variable, must be less than zero.
Here’s an example. Suppose ry1 = 0.40, ry2 = 0.20, and r12 = 0.60. Arranging those as a correlation matrix, we have
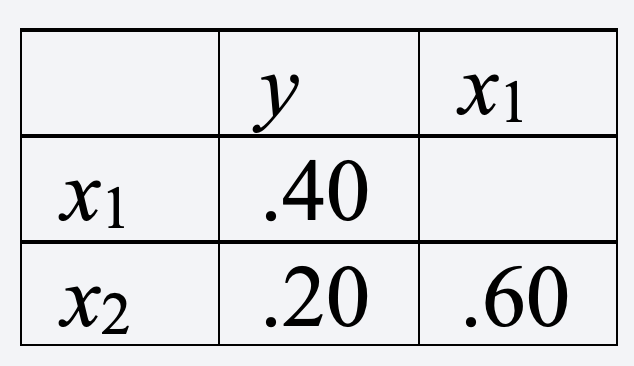
Using the well-known formula for a standardized coefficient, we get
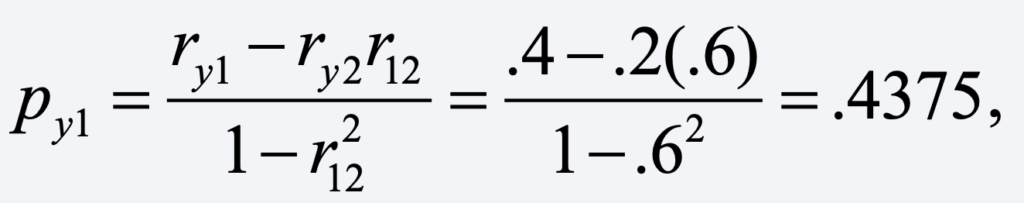
which is larger than the corresponding correlation of .40. And for the other coefficient, we get
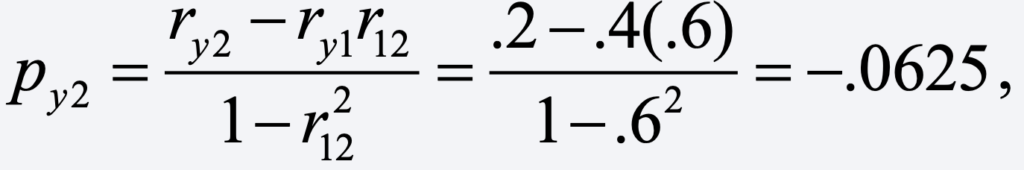
a negative coefficient.
At least for me, this all becomes more understandable when the relationships among the three variables are displayed as a path diagram. Here’s a path diagram (produced by Mplus) for the example just described:
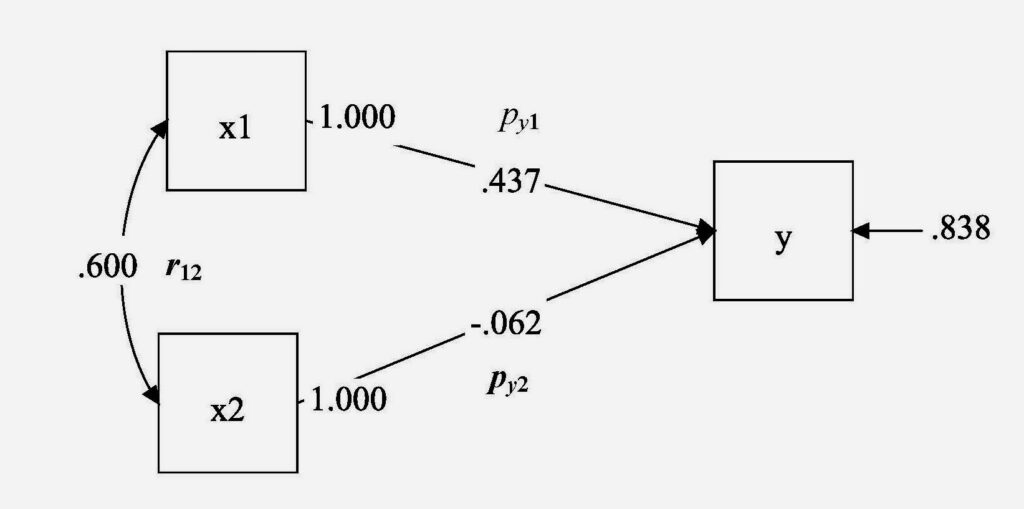
My original mistake was to claim that a suppressor effect occurs when there is an inconsistency of signs among the correlations. But I wasn’t totally off the mark. The correct way to put it is that a suppressor effect occurs when there is an inconsistency of signs among the three arrows in this diagram. In this example, we have a positive correlation between x1 and x2, but the effects of those two variables have opposite signs. There would also be a suppressor effect if the correlation between x1 and x2 were negative, but the two standardized coefficients had the same sign.
That’s evident from the tracing rule for path diagrams, which says that
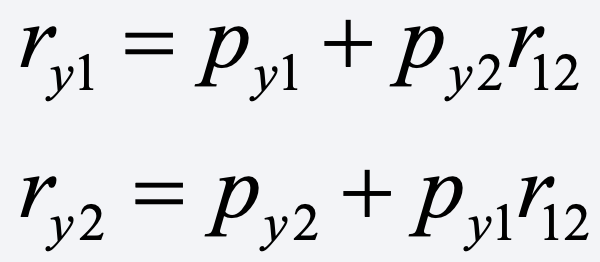
Let’s rewrite this as
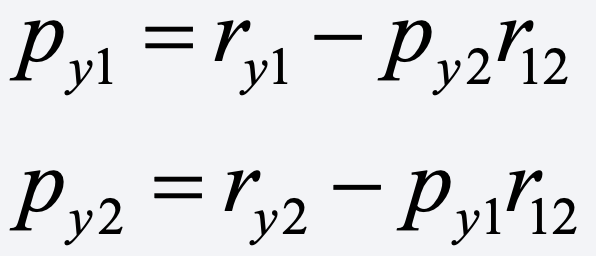
Now, it’s easy to see what happens when the signs of these parameters vary. For example, assuming that ry1 is positive, py1 will be larger than ry1 whenever either (a) py2 is negative and r12 is positive or (b) py2 is positive and r12 is negative.
Overall, one take-away is that suppressor effects can occur more often than we might expect. An important implication, which I have long emphasized in my linear regression courses, is that we should be very wary of relying on bivariate correlations to suggest what variables ought to go into a regression model. A bivariate correlation may be small and not statistically significant, and yet, in reality, the independent variable may actually have a big effect on the dependent variable when other variables are controlled.
For several detailed empirical examples of suppressor effects, see Richard Williams’ excellent tutorial.