Directed Acyclic Graphs for Causal Inference - Online Course
A 4-Day Livestream Seminar Taught by
Felix ElwertTuesday, June 3 –
Friday, June 6, 2025
10:30am-12:30pm (convert to your local time)
1:30pm-3:00pm
This seminar offers an applied introduction to directed acyclic graphs (DAGs) for causal inference. DAGs are a powerful new tool for understanding and resolving causal issues in empirical research. DAGs are useful for social and biomedical researchers, and for business and policy analysts who want to draw causal inferences from non-experimental data. A major attraction of DAGs is that they are “algebra-free,” relying instead on intuitive yet rigorous graphical rules.
Starting June 3, we are offering this seminar as a 4-day synchronous*, livestream workshop held via the free video-conferencing software Zoom. Each day will consist of two lecture sessions which include hands-on exercises, separated by a 1-hour break. You are encouraged to join the lecture live, but will have the opportunity to view the recorded session later in the day if you are unable to attend at the scheduled time.
*We understand that finding time to participate in livestream courses can be difficult. If you prefer, you may take all or part of the course asynchronously. The video recordings will be made available within 24 hours of each session and will be accessible for four weeks after the seminar, meaning that you will get all of the class content and discussions even if you cannot participate synchronously.
Closed captioning is available for all live and recorded sessions. Captions can be translated to a variety of languages including Spanish, Korean, and Italian. For more information, click here.
ECTS Equivalent Points: 1
More details about the course content
The two primary uses of DAGs are (1) determining when causal effects can be identified from observed data, and (2) deriving the testable implications of a causal model. DAGs are also helpful for understanding the causal assumptions behind widely used estimation strategies, such as regression, matching, and instrumental variables analysis.
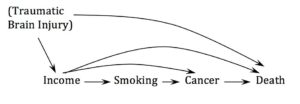
To provide a flavor for what we will cover in this class, consider the following DAG:

This is a stylized causal model relating an early health variable, income, smoking, cancer, and death. DAGs help us to see which inferences we can make and which inferences we cannot make. For example, if this model describes the true data generating process and if traumatic brain injury is unmeasured, then it would be possible to identify the causal effect of income on smoking but NOT the causal effect of income on death.
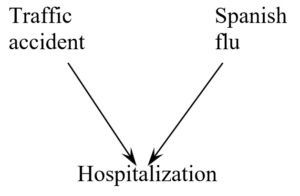
DAGs can also help us avoid common errors in interpretation by allowing us to derive associations between variables from a causal model. The graph below illustrates Berkson’s bias, a famous example of selection bias.

If both traffic accidents and the flu land people in the hospital, then a study of hospital records would show that accidents are negatively associated with having the flu. Does that mean that having the flu makes me a better driver? Or that getting in an accident is as good as a flu shot? Obviously not! But we will learn why researchers make these kind of errors regularly, how to avoid them, and what to do about them to make correct inferences.
The seminar will start by introducing the essential elements for causal reasoning with DAGs and then use DAGs to discuss a range of important challenges in observational data analysis. Topics include: conditions for the identification of causal effects; d-separation; the difference between confounding, over-control, and selection bias; identification by adjustment; backdoor identification; what variables to control for in observational research; what variables not to control for in observational research; structural assumptions in regression; and causal mediation analysis.
This seminar will empower you to recognize and understand problems and to spot fresh opportunities for causal inference in your own data. This is a hands–on course with carefully structured and supervised exercises. Many of these exercises will use the freeware package DAGitty which allows users to draw and analyze causal graphs. See the computing section below for more details.
For background and preparation, we recommend reading:
Keele L, Stevenson RT, Elwert F (2019). “The causal interpretation of estimated associations in regression models.” Political Science Research and Methods. Click here.
The two primary uses of DAGs are (1) determining when causal effects can be identified from observed data, and (2) deriving the testable implications of a causal model. DAGs are also helpful for understanding the causal assumptions behind widely used estimation strategies, such as regression, matching, and instrumental variables analysis.
To provide a flavor for what we will cover in this class, consider the following DAG:
This is a stylized causal model relating an early health variable, income, smoking, cancer, and death. DAGs help us to see which inferences we can make and which inferences we cannot make. For example, if this model describes the true data generating process and if traumatic brain injury is unmeasured, then it would be possible to identify the causal effect of income on smoking but NOT the causal effect of income on death.
DAGs can also help us avoid common errors in interpretation by allowing us to derive associations between variables from a causal model. The graph below illustrates Berkson’s bias, a famous example of selection bias.
If both traffic accidents and the flu land people in the hospital, then a study of hospital records would show that accidents are negatively associated with having the flu. Does that mean that having the flu makes me a better driver? Or that getting in an accident is as good as a flu shot? Obviously not! But we will learn why researchers make these kind of errors regularly, how to avoid them, and what to do about them to make correct inferences.
The seminar will start by introducing the essential elements for causal reasoning with DAGs and then use DAGs to discuss a range of important challenges in observational data analysis. Topics include: conditions for the identification of causal effects; d-separation; the difference between confounding, over-control, and selection bias; identification by adjustment; backdoor identification; what variables to control for in observational research; what variables not to control for in observational research; structural assumptions in regression; and causal mediation analysis.
This seminar will empower you to recognize and understand problems and to spot fresh opportunities for causal inference in your own data. This is a hands–on course with carefully structured and supervised exercises. Many of these exercises will use the freeware package DAGitty which allows users to draw and analyze causal graphs. See the computing section below for more details.
For background and preparation, we recommend reading:
Keele L, Stevenson RT, Elwert F (2019). “The causal interpretation of estimated associations in regression models.” Political Science Research and Methods. Click here.
Computing
To fully participate in the course, you will need your own computer. Demonstrations and exercises will make use of the freeware package DAGitty, which is available at daggity.net. We will use DAGitty in its web browser mode. However, it can also be downloaded for offline use and is available as a package for R.
DAGitty computes covariate adjustment sets for estimating causal effects, enumerates instrumental variables, derives testable implications (d-separation and vanishing tetrads), generates equivalent models, and includes a simple facility for data simulation.
Who should register?
If you want to understand under what circumstances you can draw causal inferences from non-experimental data, this course is for you. You should have a good working knowledge of multiple regression. Some prior exposure to causal inference (counterfactuals, propensity scores, instrumental variables analysis) will be helpful but is not essential.
If you want to understand under what circumstances you can draw causal inferences from non-experimental data, this course is for you. You should have a good working knowledge of multiple regression. Some prior exposure to causal inference (counterfactuals, propensity scores, instrumental variables analysis) will be helpful but is not essential.
Seminar outline
Day 1: Using graphs to notate causal models
-
- Counterfactual causality
- Directed Acyclic Graphs (DAGs)
- Elements
- Graphical display of the data generating model
- The importance of causal assumptions
Day 2: Using graphs to understand association
-
- Associational implications of a causal model
- Association vs. causation in DAGs
- Three sources of association and independence (d-separation)
- Deriving testable implications
Day 3: Using graphs to understand causal identification
-
- Graphical identification criteria
- Adjustment criterion
- Backdoor criterion
- Efficient heuristics
- Examples and insights
Day 4: Using graphs to solve applied problems
-
- Selection bias
- Lots and lots of progressively harder real examples
- Why selection and confounding are distinct causal concepts
- Graphical insights for common methods
- Identification in matching and regression
- Making sense of regression coefficients
- DAGs for mediation analysis
- “Controlled” and “natural” effects
- Identification criteria
Day 1: Using graphs to notate causal models
-
- Counterfactual causality
- Directed Acyclic Graphs (DAGs)
- Elements
- Graphical display of the data generating model
- The importance of causal assumptions
Day 2: Using graphs to understand association
-
- Associational implications of a causal model
- Association vs. causation in DAGs
- Three sources of association and independence (d-separation)
- Deriving testable implications
- Associational implications of a causal model
Day 3: Using graphs to understand causal identification
-
- Graphical identification criteria
- Adjustment criterion
- Backdoor criterion
- Efficient heuristics
- Examples and insights
- Graphical identification criteria
Day 4: Using graphs to solve applied problems
-
- Selection bias
- Lots and lots of progressively harder real examples
- Why selection and confounding are distinct causal concepts
- Graphical insights for common methods
- Identification in matching and regression
- Making sense of regression coefficients
- DAGs for mediation analysis
- “Controlled” and “natural” effects
- Identification criteria
- Selection bias
Payment information
The fee of $995 USD includes all course materials.
PayPal and all major credit cards are accepted.
Our Tax ID number is 26-4576270.
The fee of $995 USD includes all course materials.
PayPal and all major credit cards are accepted.
Our Tax ID number is 26-4576270.


