Design and Analysis of Simulation Studies - Online Course
A 4-Day Livestream Seminar Taught by
Ashley NaimiTuesday, August 19 –
Friday, August 22, 2025
10:30am-12:30pm (convert to your local time)
1:30pm-3:00pm
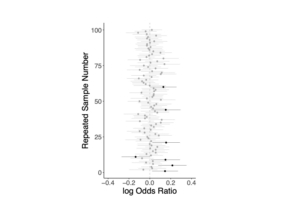
This course will focus on how to use experimental principles to appropriately design and analyze Monte Carlo simulation studies. Simulations are extremely flexible, and consequently are invaluable tools for understanding and applying a staggering range of methodologies. They are particularly useful for determining how methods will perform in the (all-too-typical) case when data analytic conditions differ from textbook-perfect ideals.
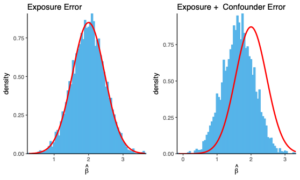
For example, simulations can be used to deepen understanding of often misunderstood concepts such as confidence intervals and hypothesis testing, to plan studies by comparing sampling strategies or running power analyses, to guide analyses by determining how well methods perform when their underlying assumptions are violated, and to assess robustness of results to threats ranging from unobserved confounding to choices about how data are coded and modeled.
|
|
|
This course will teach you how to plan, conduct, and interpret simulation studies. Particular attention will be paid to key tasks including choosing an appropriate Monte Carlo sample size; managing computation time; applying a relevant data-generating mechanism using causal inference principles (via, e.g., DAGs); and efficiently analyzing simulated data. The course will conclude with a discussion of when more complex simulation designs are warranted, such as “plasmode” simulations or synthetic simulation (via variational autoencoders or generative adversarial networks).
Starting August 19, we are offering this seminar as a 4-day synchronous*, livestream workshop held via the free video-conferencing software Zoom. Each day will consist of two lecture sessions which include hands-on exercises, separated by a 1-hour break. You are encouraged to join the lecture live, but will have the opportunity to view the recorded session later in the day if you are unable to attend at the scheduled time.
*We understand that finding time to participate in livestream courses can be difficult. If you prefer, you may take all or part of the course asynchronously. The video recordings will be made available within 24 hours of each session and will be accessible for four weeks after the seminar, meaning that you will get all of the class content and discussions even if you cannot participate synchronously.
Closed captioning is available for all live and recorded sessions. Captions can be translated to a variety of languages including Spanish, Korean, and Italian. For more information, click here.
More details about the course content
Course concepts will be illustrated through an extended comparison of two average treatment effect estimators: inverse probability weighting and marginal standardization. After briefly reviewing how these estimators work, we will design a simulation study to evaluate their performance relative to one another. Throughout, we will use this example to emphasize the general skills needed to conduct simulation studies in a range of topic areas.
This is an applied course. By the end of the course, you will be able to implement your own Monte Carlo simulation to estimate bias, mean squared error, confidence interval coverage, and other statistics for an estimator of your choice.
Computing
This seminar will use R for the empirical examples and exercises. To participate in the hands-on exercises, you are strongly encouraged to use a computer with the most recent version of R and RStudio installed. RStudio is a front-end for R that makes it easier to work with. This software is free and available for Windows, Mac, and Linux platforms.
Basic familiarity with R is highly desirable, but even novice R coders should be able to follow the presentation and do the exercises.
If you’d like to take this course but are concerned that you don’t know enough R, there are excellent online resources for learning the basics. Here are our recommendations.
Who should register?
This course is ideal for anyone interested in learning how to use simulations to deepen their statistical intuitions, as well as for those who work with messy data and need to evaluate how methods will perform in situations that differ from textbook-perfect examples. You should have a basic understanding of probability and statistics, as well as standard (linear and generalized linear) regression modeling.
This course is ideal for anyone interested in learning how to use simulations to deepen their statistical intuitions, as well as for those who work with messy data and need to evaluate how methods will perform in situations that differ from textbook-perfect examples. You should have a basic understanding of probability and statistics, as well as standard (linear and generalized linear) regression modeling.
Seminar outline
Day 1 (morning):
-
- Why simulate?
- An example question: Comparing IP-weighting with marginal standardization
- An overview of simulation designs
- Systems dynamics models, compartmental models, agent-based models
- Monte Carlo estimation versus Monte Carlo simulation
- Plasmode and synthetic simulations
Day 1 (afternoon):
-
- Key distributions in the R stats package
- Important R functions:
- For loops
- The apply family
- Seeds
- User-defined functions (expit, logit, other)
Day 2 (morning):
-
- Simple example 1: Comparing the mean versus median as an estimator
- Simple example 2: Simple regression simulation
Day 2 (afternoon):
-
- Regression models and distributions for simulation studies
- Simple example 3: IP weighting versus marginal standardization
Day 3 (morning):
-
- Aims of the simulation
- Data generating mechanisms: Directed acyclic graphs
- What is your estimand?
- Choosing simulation parameters
- The true parameter value and the oracle estimator
- Estimators to evaluate
Day 3 (afternoon):
-
- Computational considerations:
- When do small differences become big ones?
- Profiling functions (what’s slowing me down?)
- Parallel processing
Day 4 (morning):
-
- Computing performance measures
- Bias, mean squared error, efficiency, CI coverage, and length
- Analyzing and interpreting simulation results: Nested Loop Plots
Day 4 (afternoon):
-
- Putting it all together
- Worked example: How does IP-weighting compare to marginal standardization?
Day 1 (morning):
-
- Why simulate?
- An example question: Comparing IP-weighting with marginal standardization
- An overview of simulation designs
- Systems dynamics models, compartmental models, agent-based models
- Monte Carlo estimation versus Monte Carlo simulation
- Plasmode and synthetic simulations
Day 1 (afternoon):
-
- Key distributions in the R stats package
- Important R functions:
- For loops
- The apply family
- Seeds
- User-defined functions (expit, logit, other)
Day 2 (morning):
-
- Simple example 1: Comparing the mean versus median as an estimator
- Simple example 2: Simple regression simulation
Day 2 (afternoon):
-
- Regression models and distributions for simulation studies
- Simple example 3: IP weighting versus marginal standardization
Day 3 (morning):
-
- Aims of the simulation
- Data generating mechanisms: Directed acyclic graphs
- What is your estimand?
- Choosing simulation parameters
- The true parameter value and the oracle estimator
- Estimators to evaluate
Day 3 (afternoon):
-
- Computational considerations:
- When do small differences become big ones?
- Profiling functions (what’s slowing me down?)
- Parallel processing
- Computational considerations:
Day 4 (morning):
-
- Computing performance measures
- Bias, mean squared error, efficiency, CI coverage, and length
- Analyzing and interpreting simulation results: Nested Loop Plots
- Computing performance measures
Day 4 (afternoon):
-
- Putting it all together
- Worked example: How does IP-weighting compare to marginal standardization?
Payment information
The fee of $995 includes all course materials.
PayPal and all major credit cards are accepted.
Our Tax ID number is 26-4576270.
The fee of $995 includes all course materials.
PayPal and all major credit cards are accepted.
Our Tax ID number is 26-4576270.


