
This semester I am teaching a graduate course at Penn State on Machine Learning for Political Research, and in June I will teach a seminar on machine learning for Statistical Horizons. This has led me to reflect on how lucky I was to step into the world of machine learning when I did, and to think about what makes a piece of quantitative research a “machine learning” project. In this post, I’d like to share my very first experience with machine learning research.
Some research agendas start out as organized and well-formed pursuits. Others come about because you stumble down a certain path for so long that there’s no turning back. I finished my Ph.D. in political science at the University of North Carolina Chapel Hill in 2010. Remarkably, I was the first student in my department to pursue a major field in research methods. As one of the requirements, my faculty insisted that I take some methods courses in other departments.
When I told my advisor, Tom Carsey, that I had enrolled in a course in the computer science department titled Data Mining, he was shocked. At that time, data mining was a phrase that was used pejoratively in political science to refer to cheating with data. To Tom’s credit, his curiosity won out, and he let me stay in the course. Taught by Professor Wei Wang, it seeded my first machine learning project, as well as my long-term research agenda and teaching portfolio.
Project Overview
One of the topics that Wang covered was “association rule mining.” Association rules (Diaz-Garcia et al. 2023) are patterns regarding bundles of items that appear together in large, multivariate databases at unexpectedly high rates. For example, in a database from a grocery store, customers may buy milk, butter, and eggs together at a higher rate than we would expect based on the rates at which milk, butter, and eggs are purchased on an individual basis.
LEARN MORE IN A SEMINAR WITH BRUCE DESMARAIS
At the same time, I was taking a course on Judicial Process, taught by Professor Isaac Unah. In Unah’s course, we were covering strategic models of the U.S. Supreme Court. One concept that comes up in the game-theoretic literature on the Supreme Court is the “coalition”–a group of justices that work together to pursue an outcome in a case. Taking these two courses together, I started to think about coalitions of justices as association rules in the opinion-by-opinion outcomes on cases, and ended up writing a paper on this for both courses.
This project evolved into a chapter of my dissertation, and eventually into an article that was published in the journal Public Choice (Desmarais 2012). It was the only publication to come out of my dissertation. So, what exactly did I do with this idea of coalitions of justices as association rules? I realized that this conceptual adaptation was applicable beyond data on the Supreme Court and was appropriate for many collective choice databases in which we observe repeated qualitative decisions made simultaneously by a common set of actors (e.g., legislators voting on bills, groups of countries considering whether to intervene in a militarized conflict).
In this project, I used one dataset from Johnson et al. (2006) in which they analyzed voting by members of the U.S. Supreme Court, and another from Gartzke and Gleditsch (2004) in which they studied whether countries intervened on behalf of their allies involved in militarized disputes. Both studies modeled the behavior of the individuals (voting or interventions) using logistic regressions in which each choice was assumed to be made independently, conditional on covariates. I simulated the two-entity associations that were implied by those models, and searched for simple association rules that were poorly predicted by the models.
The question then was whether the same association patterns present in the observed data would also appear in the simulated data. If the model failed to simulate an association rule accurately, I called that a joint prediction error (JPE). My recommendation was that researchers study the patterns in the JPEs to suggest improvements to their empirical models.
In the two example datasets, I found a strikingly consistent pattern. Nearly all of the JPEs that were underpredictions—association rules appearing more frequently in the data than in the simulations—were patterns of either justices or countries taking the same action (e.g., two justices signing on to the same side of a case, two countries deciding to either join or stay out of a conflict). Nearly all of the JPEs that were overpredictions–appearing less frequently in the data than in the simulations–were patterns of either justices or countries taking opposite actions (e.g., two justices signing on to opposing sides of a case, one country entering a conflict while another sat out).
This was not a surprising finding—that statistical models built on the assumption that individual actors make entirely independent decisions, conditional on covariates, did not accurately capture the tendencies toward cooperation. This common feature of these two datasets was, nonetheless, brought to light through the analysis of prediction errors.
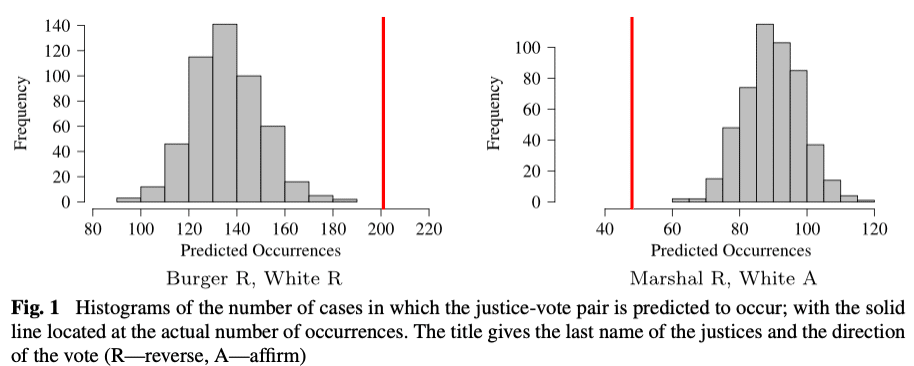
Figure 1, a reprinted reduced version from the original article, illustrates this key result. Each plot gives a histogram of the frequency with which the pair of outcomes is predicted to occur, based on the simulation. The red line on each plot gives the frequency with which the pair of outcomes actually occurred in the observed data. The joint outcomes depicted on the left side, in which the frequency of observed occurrences is in or beyond the right tail of the distribution of simulated outcomes, are those in which both justices vote either to reverse or affirm the lower court. The joint outcomes depicted on the right side, in which the frequency of observed occurrences is in the left tail of the distribution of simulated outcomes, are those in which one justice votes to affirm and the other votes to reverse.
These patterns suggested a simple update of the models that should be used for these data–they should be able to account for the association among the simultaneous choices that were being made. This is a case of the more general pattern of high intra-class correlation, where entities in the same group tend to be highly similar. In both examples, I extended the empirical models to include random effects that were shared by groups of actors making decisions at the same time (see Pendergast et al. 1996 for more on the use of random effects to model intraclass correlation).
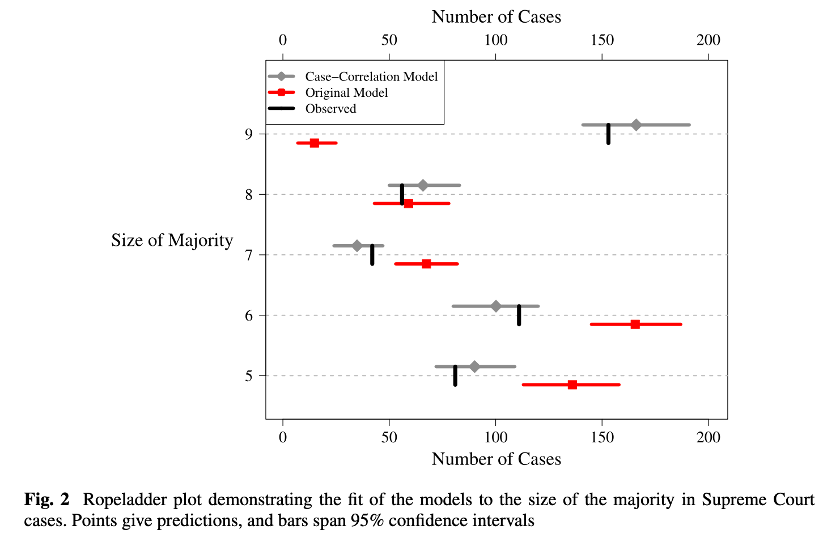
Using out-of-sample predictions, I demonstrated that this simple update improved the performance of the models relative to those that appeared in the original publications. Overall, in both applications, the cross-validated deviance was reduced by more than 20% by including the random effects. In Figure 2, I reproduce a more interpretable visualization of the improvement in fit in the model of the Supreme Court. The y-axis gives the number of justices in the majority on the case, and the x-axis gives the number of cases in the data. The model with the case-level random effect accurately recovers the majority size distribution, whereas the original model only accurately predicts the number of cases with eight justices in the minority.
Learning from Data, Prediction, and Machine Learning
What made this a “machine learning” project? I put it in this category because it had two related objectives. First, I designed the analysis to learn from the data, broadly speaking, based on patterns in the fit of the original models. Rather than testing one or more specific hypotheses, my goal was to observe a broad class of distinct patterns in the data that would help me improve the models. Second, I emphasized predictive performance–especially out-of-sample predictive performance–to assess the statistical models.
Conventional methods from the social science toolkit can, of course, be used to learn from data and make predictions. However, they were not designed to learn unknown patterns from data or make the most accurate predictions. Regression is designed to accurately estimate a line or hyperplane, possibly transformed by a link function, that describes a highly interpretable relationship between one or more independent variables and a dependent variable. Methods that we more commonly associate with machine learning directly, such as using tree-based models (or learners in machine learning parlance) to form predictive models for tabular data (Chen and Guestrin 2016), or neural networks to work with image data (Torres and Cantú 2022), were designed to learn from data and produce accurate predictions.
For those with training in conventional quantitative methods for social science, I believe that the best way to build towards a comprehensive understanding of machine learning is to begin by learning how tools they are already familiar with can be used for machine learning applications. Then progress towards methods in the machine learning toolkit that have been developed for optimal performance in those applications. I look forward to diving deeper into these methods with students and workshop participants in the coming months!
References
Chen, Tianqi, and Carlos Guestrin. “Xgboost: A scalable tree boosting system.” In Proceedings of the 22nd acm sigkdd international conference on knowledge discovery and data mining, pp. 785-794. 2016.
Diaz-Garcia, Jose A., M. Dolores Ruiz, and Maria J. Martin-Bautista. “A survey on the use of association rules mining techniques in textual social media.” Artificial Intelligence Review 56, no. 2 (2023): 1175-1200.
Desmarais, Bruce A. “Lessons in disguise: multivariate predictive mistakes in collective choice models.” Public Choice 151 (2012): 719-737.
Gartzke, Erik, and Kristian Skrede Gleditsch. “Why democracies may actually be less reliable allies.” American Journal of Political Science 48, no. 4 (2004): 775-795.
Johnson, Timothy R., Paul J. Wahlbeck, and James F. Spriggs. “The influence of oral arguments on the US Supreme Court.” American Political Science Review 100, no. 1 (2006): 99-113.
Pendergast, Jane F., Stephen J. Gange, Michael A. Newton, Mary J. Lindstrom, Mari Palta, and Marian R. Fisher. “A survey of methods for analyzing clustered binary response data.” International Statistical Review/Revue Internationale de Statistique (1996): 89-118.
Torres, Michelle, and Francisco Cantú. “Learning to see: Convolutional neural networks for the analysis of social science data.” Political Analysis 30, no. 1 (2022): 113-131.