When R first came out, around the year 2000, I was really excited. Here was a powerful, programmable statistical package that was free to anyone. I thought “This could revolutionize data analysis.” But when I gave it a test run, I quickly got discouraged. All the routine data management tasks seemed much harder in R than in SAS or Stata, my go-to statistical packages. And many of my favorite analytical tools (like Cox regression) that were readily available in commercial packages seemed to be missing from R. Plus, everything was formulated in terms of vectors and matrices, and I knew that wouldn’t fly with the sociology graduate students I was teaching. So I put R back on the shelf and let others play with this shiny new toy.
Fast forward 20 years and things have changed dramatically. It now seems that no matter what you want to do in statistics, there’s an R package for that. Slick interface apps like RStudio have streamlined most of the routine tasks of managing R itself. And meta-packages like the tidyverse have made data management and manipulation much easier and more straightforward.
LEARN MORE IN A SEMINAR WITH PAUL ALLISON
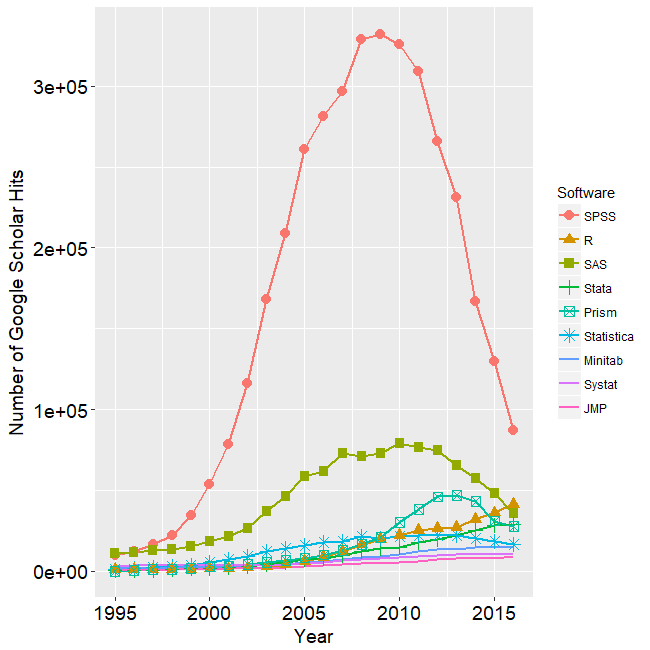
Along with those changes, the community of R users has grown enormously. It’s hard to determine the exact number of R users, but recent estimates (by Oracle and by Revolution Analytics) put the worldwide user base at about 2 million. In a regularly updated blog post, Robert Muenchen has been tracking the popularity of data science software for several years, using a variety of metrics. One graph that I found particularly interesting was this one, which shows the number of mentions of various statistical packages in scholarly articles, based on a search of Google Scholar:

The most striking feature of this graph is the overall dominance of SPSS. However, SPSS peaked in 2009 and has since suffered a massive decline. SAS has also declined greatly since 2010, and it is now below R (the orange triangles) which has been steadily increasing in scholarly mentions since its inception.
The growth in R has two important consequences:
- It’s now much easier to get answers to any kind of R question, either by a quick web search or by just asking someone who works nearby.
- You can readily communicate your program code to hundreds of thousands of other researchers, without worrying about whether they have the same software installed.
It’s this second point that I want to stress here. I’ve come to the conclusion that R should be every data analyst’s second language. To me, it’s like English. No matter what your native language, it’s extremely useful to have English as a second language so that you can communicate easily with others who don’t share your native tongue. And so it is with R.
I’ve certainly found that to be true in my own work. Although I’m far from being a skilled R programmer, I’ve recently developed enough familiarity and competence with R that I can translate nearly all of my teaching examples and exercises into R. Currently, I try to provide R code for all the seminars I teach for Statistical Horizons. My two most recent publications have included R code. And I can now do a much better job of reading and reviewing papers that include R code.
R also enables me to do some things that I can’t do in SAS or Stata. For example, R can do multiple imputation for clustered data using either the jomo package or the mice package. And for linear structural equation modeling, I prefer the lavaan package over what’s in SAS or Stata (but Mplus is still better).
More and more people who come to Statistical Horizons seminars prefer to work in R, and they really appreciate having R code. Increasingly, our new instructors also prefer to teach their courses using R. Of course, that’s mainly a cohort phenomenon. Statistics departments overwhelmingly prefer to teach with R, at both the undergraduate and graduate levels, so there are thousands of newly-minted R users every year.
Don’t get me wrong, there are still lots of things I don’t like about R. There are so many user-contributed R packages that it’s hard to figure out which one will do what you want. And because there will often be many packages that will do you want, you then have the problem of figuring out which one is best. Documentation for many packages is sparse or poorly written. Even more bothersome is that some packages conflict with other packages because they have functions (or other elements) that share the same names. That can cause serious headaches.
Despite those problems, I am confident that R has a bright future. There are even newer competitors (like Python) that are favored in the data science/machine learning community. But R has reached such a critical mass that it will be very hard to stop.
How do you go about learning R? Well, there are lots of good materials on the web. But I think the best way is to take our seminar Introduction to R for Data Analysis taught by Professor Andrew Miles. It’s designed for people who are reasonably proficient in statistics and already familiar with another package (like SPSS, SAS or Stata), but who just want to learn how to do those same things in R. In two days, you’ll get comfortable enough with R to do most of the statistical tasks that you are already doing in other packages. Andrew’s course also has lots of hands-on exercises, something that’s essential for deep learning of any new tool. You can get more information about his course here.


Comments
I know this is an old thread, but I wanted to say that Stata remains my go-to statistics package, and with the new integration with Python, my second language is Python, which I am learning now. Python seems to have all or most of the AI/Machine Learning packages that complement Stata’s superb statistical functions and general ease of use.
Excellent points that R allows you to do many things that are not possible / easy to do in other statistical programming languages.
I’ve personally found the R tutorials on Statology super helpful as references: https://www.statology.org/r-guides/
There’s something a little strange about that graph. If you add up all the curves, it appears that the total mentions of *any* statistical package have declined threefold since 2009. Do you believe that? Seems like some kind of artifact.
Good point. But I don’t have an answer. You might want to write Bob Muenchen about it, or post a comment to his blog.
As a longtime Stata user and R dabbler, I agree that having familiarity with R is useful. One package that might be really helpful for social scientists who do latent variable modeling is the Mplus Automation package, by Michael Nallquist, which provides facilities to write input files, run multiple input files, and even scrape Mplus output and graphics. https://github.com/michaelhallquist/MplusAutomation There is a similar, but perhaps not quite as robust, package in Stata, called runmplus. https://www.lvmworkshop.org/home/runmplus-stuff
I agree, Mplus automation is an extremely useful package.
I’m glad you found it. Stata didn’t excite me but I’ve hit the ground running with R. The data viz and GIS functionality are more advanced than many other tools and something that stands out is the extra file types. RMarkdown greatly improved readability and .Rproj files are a must in sharing code. An Rmd file can also run on shiny to create a flexdashboard which shows interactivity (and simpler than learning shiny syntax). RNotebooks are one other file type I haven’t used much but allow you to incorporate python, SQL, and other languages within your Rmd. Lastly, there are some excellent add-ins for RStudio that can style your code, open your data in Excel, spell check, pick colors and edit ggplots, help with regular expressions, and much more.
For the point of easy communication, I thought similarly until I came across codes written in tidyverse which is like a completely different programming language. I had spent hard time to learn (classic) R only to find myself unable to understand the code unless I spent more time to learn tidyverse (which is said basically another way to do essentially the same thing). There is more discussion at the r4stats blog http://r4stats.com/2017/03/23/the-tidyverse-curse/. As a long time Stata user, I can say that the code written a decade ago can still be read without much extra effort and probably also run much faster without changing a single line of code (using Stata MP). The syntax of Stata commands, including the user-written commands, are also much more consistent (for consistency of R syntax see discussion at http://r4stats.com/articles/why-r-is-hard-to-learn/).
I agree that there are lots of things about R that are annoying and that make it difficult to learn. The same can be said about English as a second language (https://www.daytranslations.com/blog/2018/01/why-learning-english-is-difficult-10617/).
But that doesn’t make it any less valuable. I’m just saying that basic R literacy is something that every data analyst should aspire to.
Yes R can be an excellent second language. Regarding English, it is not necessarily more difficult to learn than other languages. For example, some Mandarin speakers actually found Cantonese more challenging to learn than English, despite Mandarin and Cantonese are both “Chinese”. Some example in the link I believe are just specific to one country/region. For example “Hamburger has no ham” – the food was just called “burger” in the UK by every store until Five Guys arrived. When I first visited Five Guys in the UK I was indeed confused.
I agree completely. Two more advantages of R
1) The program and results are in the same document
2) Program output and programs are in a text file (no fancy output but takes up very little memory
3) The fst package enables great data compression and very fast reads and writes. For a large data set (200k+ individuals) comparison R (fst) 15 MB, SPSS (compresssed) 90 MB, Stata 500 MB